Knowledge Center
- Downloads
- Technical Newsletter
- Recommended Guidelines and References
- Specifications
- Technical Papers
- Tools and Calculators
- Training
- Articles, Tips and Requirements
- An Integrated Approach to Manage Vibration Risks
- Design Requirements for Reciprocating Compressors
- Evaluating Compressor Operating Risks
- Five simple methods to check reciprocating compressor performance
- Important Differences in Pulsation Software
- Liquid Pumping Systems (Including Liquid Pipelines)
- Noise Regulations Around the World
- Noise Risks in the Gas Industry
- Performance Monitoring Examples
- Pipe Support Stiffness, GMRC Project
- Piping Vibration Design Considerations
- Piping Vibration Examples
- Structural Vibration and Ways to Avoid It
- Tips for a Successful Project (Vibration Control)
- Transient Conditions on Small-Bore Piping
- Vendor Requirements for Piping Vibration & Integrity Assessment
- Vibration-induced fatigue (whitepaper)
- Vibration Issues Affecting Gas Compressor Facilities
- Ask the expert
Five simple methods to check reciprocating compressor performance
How to spot-check the performance of a reciprocating compressor
By Dr. Bryan Long, principal consultant – vibration dynamics and noise
There are often occasions when it is desirable to spot-check the performance of a reciprocating compressor; just after a rebuild, as part of commissioning or when something seems different.
Here are a few things you can do:
| # |
Method, pros and cons |
Rating | ||
|---|---|---|---|---|
| Quantification of difference in throughput | Diagnostic insight | Ease of use | ||
| 1 | Compare measured flow with that predicted by OEM sizing (or other) software. This is easy to do once a model has been created. Creating the model is not difficult but requires accurate load step numbers (clearances). |
|||
| 2 | Compare inter-stage pressures with software model predictions |
|||
| 3 |
For cylinders on the same stage, compare discharge temperatures. |
|||
| 4 |
Check for hot valves by comparing equivalent valve cap temperatures |
|||
| 5 |
Calculate the capacity of each stage separately based on observed pressures and suction temperatures and look for significant discrepancy. A model is not required but best to set up an Excel calculation (which requires gas properties). If there is a significant difference, the lower value is the more accurate result, and the other stage has a problem. |
|||
| 6 |
Detailed analysis of pressure-volume curves along with ultrasonic patterns. Well, this is not so simple; included here for comparison.
|
|||
Examples
|
|
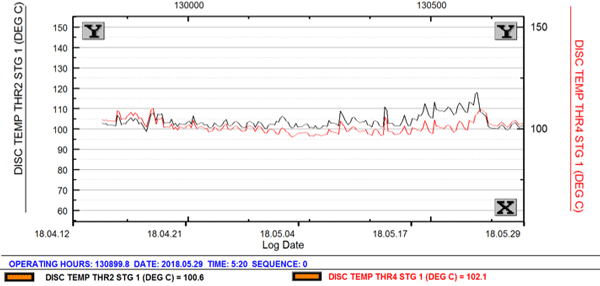
The discharge temperature of a cylinder with a valve leak (black curve) increased, compared to another cylinder on the same stage (red), until a repair was made. |
 |
|
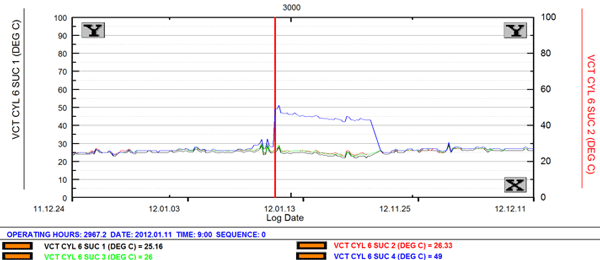
Suction valve cap temperatures show one significantly higher reading, indicating a leak. |
|
|
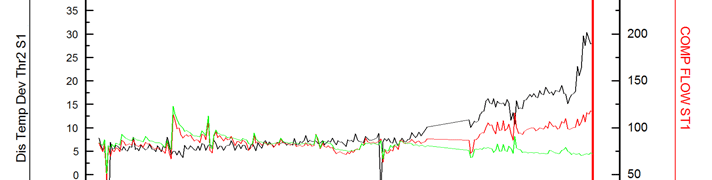
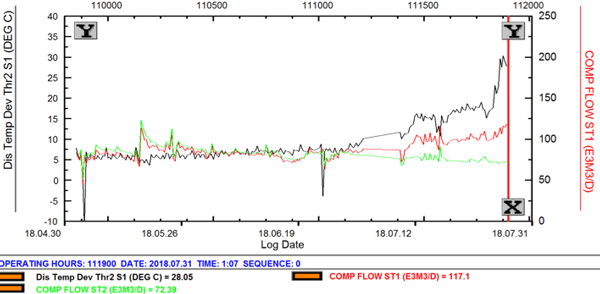
Calculated capacity of stage 1 increases relative to stage 2 as a leak develops. The leak is verified by the rising discharge temperature deviation (black curve). |
Related Pages
Performance Assessment (Thermodynamic) • Machinery Condition and Performance Monitoring • Condition Monitoring and Remote Vibration Analysis •
Free webinar

Learn how to select and design vibration control solutions that work – using real-world data and case studies. Register now
